FitnessDoc, Dr Ross Tucker, takes a look at the Tour de France and the power outputs of elite cyclists in the mountains and questions whether the increased output is down to physiology or technology or both.
The power outputs of elite cyclists in the mountains is always a nice topic of discussion, especially among those of you who measure power output and enjoy comparing yourself to the pros. So perhaps the numbers below will put into perspective just what it takes to ride at the front of a race like the Tour.
In the Tours first climbing stage, the climbing time of the lead group was around 25:22 (for Contador, 25:43 for the rest), compared to the time of 22:55 when Jan Ullrich won on the same climb back in 1997.
Some have suggested that this slowing of the times was an indication that the Tour is "cleaner" now - the fight against doping is being won, and the slower times are the outcome of having fewer doped riders pumping the pedals powered by all manner of EPO, GH, Insulin, testosterone and who knows what else.
So I want to take a look back on the Tour, and just how fast it used to be. Unfortunately, I don't have data that span the most important period (2002 to 2006), but it does provide a good starting point for the debate, and a topic of discussion while the Tour rolls over the flatlands before the next big rendevous in the French Alps this weekend.
Is leTour 2009 "clean"?...too early to tell, too many confounders
To begin with, it's too early to answer the question definitively. There are simply too many confounding factors that can't be controlled - the weather, the temperature, the race tactics, the quality of the riders, the race situation - all these things impact on the estimated power output, and given that we've only really seen about 2km of all-out racing on the climbs, it's impossible to infer too much.
For example, if you compared the climb of the Tourmalet to the climbs during the period 1995 to about 2006, you'd find an enormous difference - the Tourmalet has rarely been climbed so slowly. But that tells us nothing of the doping situation, but rather the stage profile, with 70km of riding after the summit negating the climb. So one must be careful to avoid the trap of looking at the numbers blindly and in isolation.
I think that if we look back on the 2009 Tour in a few years, it will make interesting reading though. Over a period of years, and maybe 15 to 20 climbs, it starts to become more meaningful to compare times and power outputs, because factors like tactics and weather start to "wash" out and trends become more meaningful than isolated observations.
So let's begin with a dose of realism - Contador and co may have climbed three minutes slower than Ullrich on Arcalis, but that ALONE doesn't tell us too much. There are however other factors that contribute to the argument, and we'll get to those shortly.
First, let's look at the power outputs that have been estimated for pros on the major climbs of the Tour in the past. Remember of course that all the above "confounders" or limitations exist for this analysis as well, but by looking long-term, at trends, we can still gather useful information, as I explained above.
But race context, environment, strategy - all these things affect it, and I'm well aware of this limitation. I do however maintain that taking a long term view allows interesting trends to emerge, despite the limitations. The mistake would be to zone in on specific climbs, but that's not what this is about.
Power output on major climbs - the Tour champions over the years
Below is a graph showing the estimated power output* for the eventual Tour winner on the final climb of the Tours between 1989 and 2001. In other words, in 1989, Greg Lemond would go on to win the Tour, and what has been done here is to estimate his power output on the final climb of each mountain stage and then average them for that year. Same for Lemond in 1990, then Indurain, Riis, Ullrich, Pantani and Armstrong.
Note that for all years, the power output has been "normalised" by expressing it relative to body weight. This is important, because Indurain, for example, was much larger than Pantani. Pantani at a power output of 350W was thus the equivalent of Indurain riding at around 500W.
So, to compare them, one either has to express power output per kilogram, or express it for a standard weight. I've taken the approach of expressing it relative to body weight.
It makes for some interesting reading - Greg Lemond averaged 5.7 W/kg on the final climbs during both his Tour wins. Then Indurain started off with an average power output of 5.3 W/kg, followed by 4.91 W/kg, and then it began to climb, so much so that when Indurain won his fifth Tour in 1995, his average power output on the final climbs of the mountain stages was an incredible 6.35 W/kg. (Just to labour the point - if you want to work out the ABSOLUTE power output for each rider, just multiply the power I've shown by the rider's mass. For Indurain, multiply by 80kg and you get a value of 508W) .
That high power output was maintained for the next four years, Riis averaged 6.47 W/kg, Ullrich 6.33 W/kg, and then Marco Pantani set the 'record' when he averaged 6.63 W/kg during the 1998 Tour.
In 1999, which was the year after the big Festina scandal, the power output decreased to 5.88 W/kg, and then it began a progressive climb in 2000 and 2001, so that it was back up to 6.3 W/kg in 2001.
That, unfortunately, is where the data I have ends - see the footnote below.
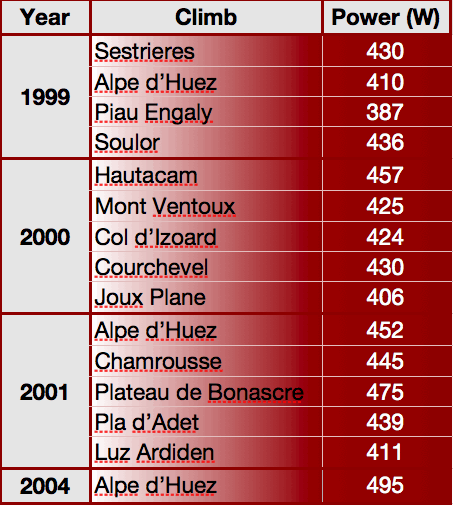
However, we do know that Lance Armstrong's power output on Alp d'Huez in 2004 was calculated as 495W - this was presented as a scientific paper at the ACSM congress in Nashville in 2005, and I noticed the power output.
It equates to 6.97 W/kg (as shown in the graph). It must be noted that this was the time-trial stage and so the climb was performed without other climbs and a day of racing before, and so should be slightly higher.
However, what's really interesting to note is that even with this apparent "freshness", Armstrong still only rode 25 seconds faster in the 2004 climb than in 2001, when he won atop the Alp as well (after a long stage). The effect of the fatigue exists, but it's not as profound as I think one first imagines.
Whether the power output was as high as this on other climbs between 2002 and 2007, I'm not sure - if you look at a list of the best times ever recorded on these climbs, you'll find that many were set in this era from 2002 to 2007.
Pantani still holds most of the records, but the generation 2002 to 2007 are in amongst the best times, faster than Riis and Ullrich, and so I suspect that the power outputs during this period as comparable to those achieved in the period 1994 to 1998, and 2000 to 2001.
Therefore, the power output from 2002 to 2005 at least will be in the same range - 6.3 W/kg or higher.
To unpack the graph above in a bit more detail, the table below shows the power output estimated for Lance Armstrong during his three Tour wins in this recording period (1999 to 2001):
What does it take to ride the Tour?
There are a number of ways to interpret these numbers. First of all, it puts into perspective the enormous power output required to be competitive in the pro-peloton in the mountains. Take any of the above riders, and you'll find that you have to be able to sustain a power output well above 6W/kg.
Greg Lemond, and Miguel Indurain's first few Tours were won with power outputs lower than this, but ever since, anything less than 6W/kg is not high enough.
In fact, since the mid-90s, 6.2 W/kg seems to be the minimum requirement, apart from the "aberration" of 1999 when the Tour was on full alert after the fiasco of 1998 and Festina-gate.
Physiologically speaking, riding at 6.2 W/kg for up to 40 minutes is quite extra-ordinary. Elite athletes are usually able to sustain power outputs between 80% and 90% of maximum for a prolonged time.
If a rider is able to sustain a power output of 6.3 W/kg for 30 minutes, then you can infer their peak power output will be somewhere between 7 and 7.5 W/kg, incredibly high.
If you are a cyclist who monitors your own power output, then, work out what 6.3 W/kg means for you (say, 520 W), and next time you are riding on a slope of about 7 to 9%, try to hold that power output for as long as possible. It is an eye-opener that is for sure.
The doping implication
I'm sure most of you reading this have already made the junction and are asking what is physiologically possible? That is, Greg Lemond was down at 5.7 W/kg, and then within five years, the power output has climbed by 10%, and then continued to climb, so that Marco Pantani is 15% higher than Lemond.
That level of progress is not typical of mere physiology, so it does point to something, and that "something" of course, is doping. Or is it? Perhaps we should be expecting sustainable power outputs of 6.3 W/kg?
I do have to point out the following though - remember that these power outputs are estimated based on time. Therefore, technological changes such as a reduction in the weight of the equipment, stiffer bikes (as pointed out by a commenter), and better components will make a difference to estimated power output, even though the calibre of riders haven't changed at all. Part of the changes you see in that graph can therefore be attributed to changes in technology.
The question is how much does technology explain? That depends what you want to believe, unfortunately. If you want to believe that cycling is clean, or rather, was clean right up to and after the Armstrong era, then you'll say that technology accounts for a 10% improvement.
That would mean that the power outputs of 2001 are "expected". Put differently, this argument says that Lemond on the same equipment would also be producing 6.3 W/kg.
Others would say that technology contributes little to this growth. I don't know the answer, but I do think that the impact of technology has been overstated and that the greatest reason for the change you see in that graph is doping.
Yes, bikes are lighter, stiffer and therefore times should improve. But, at the same time, we know that Riis, Ullrich and Pantani have all been implicated (or straight out confessed), and so their performances are likely drug aided.
Therefore, the fact that Riis, Ullrich and Pantani achieved such high power outputs relative to Lemond is an indication that either:
- The drugs don't work and technology really is responsible for all of the increase;
- The drugs do help and the technology is not that big a factor after all.
Of course, this itself assumes that these riders were doping, but I think it's pretty reasonable to say that, in hindsight. So my interpretation of the above graph is that in the 1990s, the Tour moved into a new era, where doping characterised performance, and that era peaked in the mid-90s.
The doping 'fingerprint' on performance
I read an article this week, for example, that reports that when the test for EPO was developed, samples from the 1998 and 1999 Tour were used to 'test the test', and 80% of them were found to be positive.
The poor researchers thought something was wrong with their assay, because so many samples were being found to contain EPO. There is little doubt that until that test was finally perfected for 2000, EPO abuse was rife in the peloton. The graph above spans that period nicely.
Post 2000, all indications are that the peloton went "back to basics" and blood doping, which is arguably less effective, if only because of practical difficulties around doing it. One would expect the sudden "removal" of EPO to cause a drop in pace in the peloton, of course, while riders used what they could until the teams had figured out how to bypass the systems once again.
The interesting year is 1999 - that was the first year after the Festina scandal, and the Tour was on high alert. I remember police raids of team hotels, and a general crackdown. Not from the UCI or Cycling authorities, mind you, but from the police.
So I think the lower speeds of that year were a function of greater policing, quite literally. Then, after that, the speeds just go back up again, as shown in the graph.
Cyclists may have occasionally been forced to regroup and think of how to use drugs without being caught, but they rarely stop because of the risk... Here, I think of Bernard Kohl, who has just recently highlighted just how ineffective testing is (including the passports), by his admission that for years, he used everything - Growth hormone, insulin, EPO, testosterone and blood doping, without being caught.
Now, the really interesting thing - if the mid-90s were characterised by doping and those performances are "assisted", then one cannot help but notice that the late 90s and early 2000s have produced similar performances, taking into account the short-term drop in 1999.
Since that, it's been a steady climb upward, and it would be very helpful to see what the performances of 2002 - 2005 are like, so if you have them, let me know.
There are then only two ways to explain the performances from 1999 to 2001 (and beyond, since they will remain similar, or be even better). One is that must believe that one rider is genuinely better than the effect of doping. Or, alternatively, you are left with the conclusion that his performances are an extension of what went before.
Unfortunately, no amount of evidence will prove which it is. Based on this evidence alone, I must confess that I would not deliver a verdict either way. You may be the judge.
Looking ahead
All of this is interesting, and hopefully food for thought. It doesn't exactly help us answer the question of "Is the 2009 Tour 'clean'?". That too, I'm afraid, is unanswerable as far as performance-analysis goes.
However, it does lead into the next post, which is a more subjective view of the performances in the last two years in the Tour, and what is my opinion on the state of the peloton.
(Health24's FitnessDoc, Dr Ross Tucker, July 2009. Dr Tucker also blogs on www.sportsscientists.com)
* Note: The method used for all the above estimations comes from a publication from Polar France, performed by two French scientists: Antoine Vayer and Frederic Portoleau. It was published in 2002, and called "Pouvez-vous gagner le Tour?", and it was kindly given to me by David Walsh. The method used was to calculate power output given the riding time, the mass of the rider plus equipment, and then all the factors that are typically used (rolling resistance, frontal surface area, air density, gravity, and speed). I've expressed that calculated power relative to body weight.
You'll find a number of different methods to estimate power, but all produce relatively similar values - there is some error though, which explains slight differences between these and other similar estimates. The important thing is consistency in the method, at least in as far as comparing years goes. Unfortunately, the book was published in 2002 (by PolarFrance.fr), and so I don't have the same method to work out the power output from 2002 to 2008. That would be very revealing, I believe. An analysis presented at the ACSM conference in 2005 estimated Armstrong's power output on Alpe d'Huez at 495W.


 Publications
 Partners


