Publications
 Partners


In the third installment of his series on exercise and weight-loss, FitnessDoc takes us through how exercise burns fat and the best way to go about this.
There are many reasons to want to burn fat during exercise. For obvious reasons, in the context of the series I'm currently doing, people want to burn fat during exercise to lose weight. In that regard, one must emphasise that, as much as we talk about weight loss, fat burning is the priority for most people who commit to exercise and diet in order to lose weight.
However, for those who are more interested in performance, fat burning is equally important. Ever since the 1970s, when the muscle biopsy technique first allowed scientists to "look inside" our muscles during exercise, we have understood that fatigue and performance are associated with a depletion in the body's glycogen stores.
Delaying this depletion of your body's carbohydrate stores is seen as an important adaptation to training, and we know that highly trained endurance athletes have a much greater capacity to use fat.
This is also the reason why science has looked at all kinds of strategies, like caffeine use, fat-loading, high fat diets and fat during exercise to try to delay carbohydrate depletion.
So, having made the case for fat burning, let's look at how it plays out.
A car with multiple fuel tanks: fat vs carbs
You'll know that our body is capable of using numerous sources of energy during exercise - think of your body as a car with multiple fuel tanks. The first tank is glycogen, the storage form of carbs in the muscle and liver.
The second is fat (strictly speaking, it is free fatty acids), which is stored in the muscle and in adipose tissue as triglyceride. This is summarised in the diagram below.
The problem we face is that our body's glycogen stores are finite - muscle and liver glycogen supply energy for exercise for about two hours (depending, of course, on the intensity, level of training and habitual diet, among other factors), and once they are depleted, hypoglycemia (from liver glycogen depletion) and fatigue are the result.
On the other hand, much to most people's dismay, fat stores are not limited.
"Infinite" is not the correct word, because they're not, but in terms of physiology, you have more than enough fat to power exercise for much longer than you can ever exercise, even if you're an elite athlete. Most of us are not, and so our objective is to cut down these already abundant fat stores into something a little more "acceptable".
For now, I won't go into the concept of "preferred fuels" and how the heart can use lactate, while the brain is able to use ketone bodies. I've also oversimplified by leaving protein out, but that's because I want to focus on fat vs. carbs today.
Burning fat - how fast, how long?
Perhaps the best approach to this topic is to ask when each of the fuel stores is used? In other words: how does your body decide when to use fats versus carbs as a source of fuel, and to 'fuel' the discussion by starting with some of the theories around fat burning.
The first theory is that you burn more fat when you exercise at a low intensity. That is, walking is better than running, and cycling slowly is better than cycling fast, and so on.
The idea is that your body uses carbs more and more as exercise intensity rises - this is the basis for target heart zones and the fat burning zone you see in books and on gym equipment.
Let's look at that in more detail. Below is a diagram that shows an example of how the use of fat and carbs are related as exercise intensity rises.
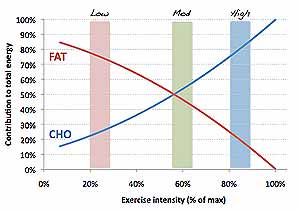
So, on the left, in the pink shaded box, you can see that at low intensities (walking, slow cycling), about 80% of your energy comes from fat, while only 20% comes from that carbohydrate (CHO) "tank".
As the exercise intensity rises, the relative contribution of fat falls while CHO rises. The result is that at about 60%, shown by the green zone, the contribution is equal - 50% from fat, 50% from CHO.
This point, at which the contribution from CHO becomes greater than that from fat, was called the cross-over point by George Brooks - a very famous exercise physiologist, who wrote a great textbook on the field (the book that was prescribed to us in my studies, in fact).
Then, as exercise intensity rises even more, the contribution from fat declines, so that by the time you're exercising vigorously, between 80 and 90% of the energy comes from CHO, and only about 15% from fat.
Just to comment on how you can measure intensity, my value is calculated as a percentage of VO2max, which is not accessible to many people. It's impossible to say exactly what heart rate that corresponds to, because it is very much dependent on the person and the context of exercise.
For some, it's a one-to-one relationship, so that 50% VO2max is 50% HRmax, whereas for others, heart rate will be higher than VO2max - 50% of VO2max would correspond to say 60% of heart rate max.
I wouldn't get too hung up about this, for reasons explained below. I know it sounds simple, but if you're wondering what 60% corresponds to, it's six out of 10 on a scale of exertion, where 10 is maximum effort.
Note also that the cross-over point, and in fact the whole pattern of the two lines is quite 'malleable' in that training, diet and genetic differences affect the relative percentage.
For example, a highly trained athlete burns fat more efficiently than an untrained person, and so they tend to use more fat at a given intensity. People who habitually eat high fat diets are also shifted to the right, meaning that they burn more fat at a given intensity.
Sympathetic nervous system activity does the reverse, shifting the lines to the left, so that you burn more CHO and less fat at any intensity. So the point is, the above graph is an example, not an absolute guide.
Low intensity is better, right?
So, what you're probably thinking is that theory that low intensity exercise is better if you want to burn fat is correct. Well, think again. It is true that at low intensity, when you walk, most of your energy comes from fat, and that as you increase the intensity, less and less comes from fat.
But what is missing in this picture is the TOTAL amount of energy. Let me phrase it this way: Would you rather have 20% of the money in Jonathan's bank account, or 80% of the money in my bank account?
Your answer of course, should be that you don't know. And what you should be asking is "How much money is in your bank accounts?". The reason is, you'd be pretty annoyed if you took 80% of my money, because my bank account might be empty. Jonathan, on the other hand, might be loaded, and 20% of his money sees you retiring at 40.
So, look at the graph again. You should not be too pre-occupied with the percentage, but rather the total amount of fat that you are burning, because that 50% that comes from fat in the green zone might be more than the 20% that comes from fat in the pink zone. For answer to that, we look at a study done many years ago by Romijn.
Below is a graph that I've redrawn with some calculated figures, based on Romijn's study.
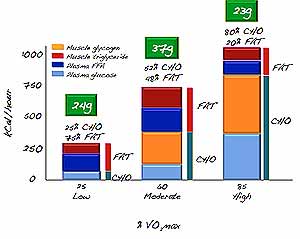
So, you're looking at the same kind of graph as before, showing how much of your energy comes from fat and CHO at different intensities (I've further divided it into muscle, liver and adipose sources, but that detail is not vital right now. Note, however that "Plasma FFA" refers to the fatty acids that originate from the adipose tissue - the triglyceride is broken down into free fatty acids which are used).
This time though, there is also a measure of HOW MUCH total energy is being used, shown by the y-axis (in kCal/hour, for an 80kg man in this case).
So again, at low intensities (25% VO2max), you'll see again that most of the energy comes from fat (75% in this case), with only 25% from CHO. Jump to 60% and the fat contribution falls to 48% and then at 85%, fat provides only 20% of the total energy. This confirms what we saw in the first graph.
But, the key is that the TOTAL energy, shown here on the Y-axis, rises as well, and so the 48% of energy from fat that you get at moderate intensity actually adds up to more TOTAL fat use than the 25% did at low intensity.
Think of the Y-axis (total energy) as the size of the bank account, if you will. The green boxes above ach bar show the total amount of fat burned in an hour - 24g, 37g and 23g per hour at the three intensities.
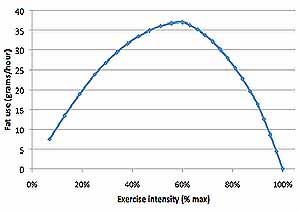
The moral of the story, which is shown further in the graph below, is that if your objective is to maximise fat burning, low intensity is not necessarily the best option. Rather, moderate intensity burns more fat per hour, before a decline in fat use as the intensity rises beyond about 60%.
The reasons for these shifts, incidentally, include increased sympathetic response to exercise, activation of different muscles as intensity increases, local regulation of metabolism in the muscle, and also the exponential nature of physiological responses to an increase in intensity. That's a post of its own!
Remember also that these are graphs based on calculations and measurements for a typical person - the actual values may vary for different people depending on training, diet and sympathetic activity, as mentioned.
One also has to make some assumptions, such as VO2max values, the RER during exercise and how it changes with intensity. But I want to highlight the principle, not the values, so bear with those assumptions.
The role of time and putting it into perspective with diet
So, what this means is that if your goal is maximum fat use, then lower intensities may mean a greater relative contribution, but it ismoderate intensity that gives you greater fat use per unit time.
Time is key though, as many of you are no doubt thinking. If you do a low intensity session, walking (25% VO2max in the above graphs), then while your total fat use per hour is not as high as at say 60%, you might be able to do this exercise for three hours, compared to only one hour at a moderate intensity.
Three hours with 24 g per hour (see figure) beats one hour with 37g. So duration plays an equally important role. What I am emphasising is that for a given time, you will be better off at a moderate intensity somewhere between 50% and 65%.
The next point, before we get too carried away, is that the actual amounts are pretty small.
Not to discourage you too much, because exercise is vital for weight management and health, but one rule of thumb is that you can estimate total energy use during running by saying that you burn 1 kcal per kilometre per kilogram.
So, taking our 80kg man, who runs 8km, he'll burn about 640 kcal. It doesn't matter how fast he runs, this amount is the same (the difference, of course, will be how much time he spends burning it).
Now, assume that half his energy comes from fat and half from carbohydrates. That means 320 kCal from fat, corresponding to 35 g (this is about the same as in the graph, since I based that graph on this kind of calculation).
So, 35 g of fat in 8 km or 5 miles. To burn 1kg of fat, he therefore has to run 230km (142 miles). Not very encouraging.
There is an additional 'after exercise' effect, which one can't ignore, but I want to make the point that actually burning fat is not as simple as we often assume. In the words of Bengt Kayser, who pointed out this principle, it puts into perspective the resolution that says "I want to burn off 10kg of fat by running".
You can work out a similar thing for cycling. If you ride for an hour at 200W, your energy use is probably going to be about 800 kcal.
If 50% of this comes from fat, then you've got 400kCal, or about 44g of fat. That is about the same rate of fat use as your 8km run gives you, and a lot of cycling to burn those 10kg of fat.
The importance of diet
And this is where diet comes into the picture. If you want to create the energy deficit in order to lose weight, and notwithstanding that this is an oversimplification as we described in Part 2B of this series, then the combination of diet and exercise the way to do it, because to actually burn energy directly is a lot more difficult than people think.
This is why the combination, and the long-term approach is so important. Things do not happen overnight in physiology, particularly when it comes to weight loss.
The progress can be slow, and invariably, when it is not, it's not sustainable. Crash dieting, starvation might lead to rapid results, but they also lead to subsequent rebounds, and health problems that we won't go into now.
But for the purposes of this post, which I'll wrap up because it's been rather heavy on numbers, the key point is that burning fat during exercise happens right across the range, and the ideal intensity, if you are looking to make the most of your time, is a moderate intensity, and not the low intensities that you'll often hear recommended.
Next time, we'll look a little more at energy use during exercise and the role of diet.
Dr Ross Tucker, is Health24’s FitnessDoc and has a Ph.D. in Exercise Physiology from the University of Cape Town and a Post-Graduate degree in Sports Management from the UCT's Faculty of Commerce. He is currently employed at the University of Cape Town and Sports Science Institute of South Africa, and works as a consultant to various sporting teams, including South African Sevens, Canoeing, Rowing and Triathlon SA. He also blogs on www.sportsscientists.com)